
 CX Genie
Amplitude vs Mixpanel: A Decision Guide for SaaS Founders
Amplitude vs Mixpanel comparison with a decision matrix on setup, learning curve, scalability, integrations, and cost-per-output for SaaS teams.

Amplitude vs Mixpanel is rarely a feature-by-feature debate. It is usually a decision about how quickly your team can get trustworthy answers (activation, retention, drop-offs) and keep that system maintainable as you scale events, users, and stakeholders.
- If you need structured analysis across multiple products, teams, and long time horizons, Amplitude is often the safer bet.
- If you want fast, hands-on product iteration with a smaller team and a simpler day-to-day workflow, Mixpanel can be a better fit.
- In amplitude vs mixpanel, the hidden cost is not the subscription. It is time spent maintaining tracking quality and answering the same questions repeatedly.
The State of the Market: The Real Difference
Direct answer (50 words): Amplitude is typically chosen for deeper, more structured product analytics across teams, while Mixpanel is often chosen for faster, more lightweight day-to-day analysis. Even though both are popular, the market is shifting toward self-serve setup, faster time-to-first-value, and automation that reduces ongoing tracking maintenance.
What is changing in practice: buyers increasingly make this choice based on four “commercial reality” drivers, not feature lists: (1) pricing unit (monthly tracked users vs tracked actions/event volume) and how predictable it stays as you instrument more, (2) data trust (can you reproduce numbers and avoid endless QA), (3) reporting speed (how fast a PM can build a defensible funnel or retention view), and (4) org adoption/governance (whether shared definitions survive multiple teams). People want a “winner,” but in practice the winner is the tool that best matches your growth path across these constraints.
Head-to-Head Comparison Table
This table is designed for decision-making, not marketing. Use it to shortlist based on your constraints: speed, simplicity, scale, and the true cost per useful insight.
| Criteria | Amplitude | Mixpanel |
|---|---|---|
| Setup Time | Often longer for teams that want a “clean measurement system” from day 1; can be quick for basic tracking but tends to expand as governance and planning increases. | Often faster to get initial dashboards running for a smaller team; many teams start simple and iterate. |
| Learning Curve | Can feel more “systematic”; strong when you need consistent definitions across stakeholders. | Typically approachable for product teams who want to explore quickly and iterate on questions. |
| Scalability | Common choice when multiple teams need shared definitions, long-term trend analysis, and consistent reporting. | Scales well for many startups and mid-market teams; complexity can rise when many teams need strict governance. |
| Integration Ecosystem | Broad ecosystem; works well in stacks where analytics must connect to data warehouses and multiple downstream tools. | Also broad; frequently used in product-led stacks where product, marketing, and lifecycle messaging need shared signals. |
| Cost-per-Output | Can be cost-effective if you repeatedly reuse standardized reports across teams; can get expensive if event volume grows without strong governance. | Can be cost-effective for smaller teams moving fast; can become expensive if event volume grows and dashboards multiply without a clear measurement plan. |
Deep Dive: Where Amplitude Outshines Mixpanel
In amplitude vs mixpanel, Amplitude tends to win when your company is moving from “one person exploring data” to “multiple teams need the same answers, every week, with the same definitions.” That is the Self-Serve to Team Expansion path in real life: an individual analyst or PM starts, then the rest of the org depends on those outputs.
1) You need shared definitions that survive team growth
- Problem: As soon as multiple people build reports, you get conflicting numbers for activation, retention, and conversion.
- Why it matters: Decision velocity drops because every meeting becomes a debate about whose dashboard is “right.”
- Where Amplitude often fits: Teams that want a more structured approach to metrics and consistent reporting across stakeholders.
2) Your analytics output is recurring, not one-off
Amplitude tends to shine when the output is something you will review weekly and operationalize, such as:
- A weekly activation report by channel and persona
- A retention view by first key action
- A “top drop-off step” view for your core conversion path
If those outputs become part of your operating rhythm, the tool that supports repeatable, standardized reporting usually wins on cost-per-output, even if list pricing is higher.
3) You have multiple products or complex user journeys
If your business has multiple surfaces (web app + mobile app, or multiple modules), the “simple early setup” advantage can disappear quickly. Amplitude is often selected when teams expect the tracking plan to expand and want the reporting structure to keep up.
Time-to-first-value caveat (important)
Many vendors promise quick time-to-first-value. In practice, “first value” is best measured, not assumed: pick one real question (for example, “Which onboarding step has the biggest drop-off?”), ask a PM who did not set up tracking to build the funnel and a shareable dashboard, and time it end-to-end. The tool that gets you to a defensible chart fastest (with clear definitions and minimal cleanup) is the one your org will actually adopt day to day.
When Should You Choose Mixpanel?
Being honest in amplitude vs mixpanel: Mixpanel can be the better choice in at least these scenarios.
Scenario A: You are a small product team that needs speed over governance
- You want to answer questions today, not after a measurement redesign.
- You have 1 to 2 people owning analytics and they sit close to product decisions.
- You expect your tracking to evolve quickly as the product changes.
Scenario B: Your “team expansion” is light, and analysis stays within product
- Most users of analytics are PMs and designers, not a large cross-functional org.
- You do not need heavy standardization across many teams.
The Migration Playbook (3 Steps)
This playbook is designed to reduce risk. The goal is to avoid a “big bang” migration that breaks reporting for weeks.
- Define 3 non-negotiable outputs (not features).
- Example outputs: “Activation rate by channel,” “Core flow drop-off by step,” “Week-4 retention by first key action.”
- Success criteria: each output can be recreated and reviewed weekly in under 5 minutes.
- Run a 14-day parallel period.
- Keep your current tool running while you recreate the 3 outputs in the new tool.
- Compare trends, not exact matching numbers (small differences happen due to definitions and timing).
- Cut over by stakeholder group, not all at once.
- Move one team first (usually product), then growth or customer success.
- Retire old dashboards only after the new ones are adopted in weekly meetings.
Decision Matrix + Expert Insight
Choose Amplitude if...
- You need consistent metrics across multiple teams and leaders.
- You expect analytics to become a shared operating system, not an individual tool.
- You want deeper structure for long-term reporting and repeatable weekly outputs.
Choose Mixpanel if...
- You are optimizing for speed and simplicity in a small team.
- Your analytics users are mostly within product and growth, not the whole org.
- You want to iterate quickly and keep the workflow lightweight.
Expert Insight: How to Evaluate Beyond the Pricing Page
- Check what drives cost: In product analytics, pricing usually scales with either monthly tracked users (MTU) or tracked actions/event volume. Forecast both: estimate next 6 months of active users, expected events per user (which rises as you instrument more features), and ask what exactly counts as a “tracked user” or “tracked action,” plus how overages and data retention work.
- Validate data trust in a trial: Pick 3 core events (for example: Sign Up, Activate, Upgrade) and sanity-check counts against your source of truth (backend logs/billing). Then check for duplicate firing, naming drift, missing properties, and whether identity resolution assumptions change funnel math. If you cannot reproduce the same metric twice, adoption will stall.
- Test decision latency: Give a non-technical teammate one question (for example, “Where do users abandon onboarding?”) and measure time-to-answer plus shareability. A useful benchmark is whether they can build a clean funnel, segment it, and share it in one sitting—because that is what drives org-wide “everyone has a tab open” adoption.
For official product details and current capabilities, validate claims directly in vendor documentation: Amplitude product overview and Mixpanel product overview.
FAQ: Amplitude vs Mixpanel
Is Amplitude or Mixpanel better for activation tracking?
Both can track activation well if your key actions are defined clearly. The practical difference is governance: if multiple teams need one shared activation definition and consistent weekly reporting, Amplitude is often chosen. If a small team is iterating quickly, Mixpanel can be easier to operate day to day.
What is the biggest hidden cost in amplitude vs mixpanel?
The biggest hidden cost is not the subscription. It is the ongoing work to keep tracking clean as your product changes: duplicated events, inconsistent naming, and dashboards that no one trusts. That cost shows up as slower decisions and repeated “data debates.”
Can I switch without losing historical data?
Many teams keep the old tool read-only for historical reference while starting fresh reporting in the new tool. If you need historical continuity, plan a scoped backfill for only the events tied to your 3 non-negotiable outputs, rather than trying to migrate everything.
How do I know the migration worked?
Your migration worked when your weekly operating meeting uses the new dashboards without side-by-side comparisons, and when at least one team shipped a change based on insights from the new system within 2 to 4 weeks.
If your main requirement is “install once and get usable product journey insights fast,” Founder OS is an alternative you can trial alongside your current setup to validate time-to-first-value before committing to a full switch. Start free and see your first dashboards within minutes.
Read Next
View all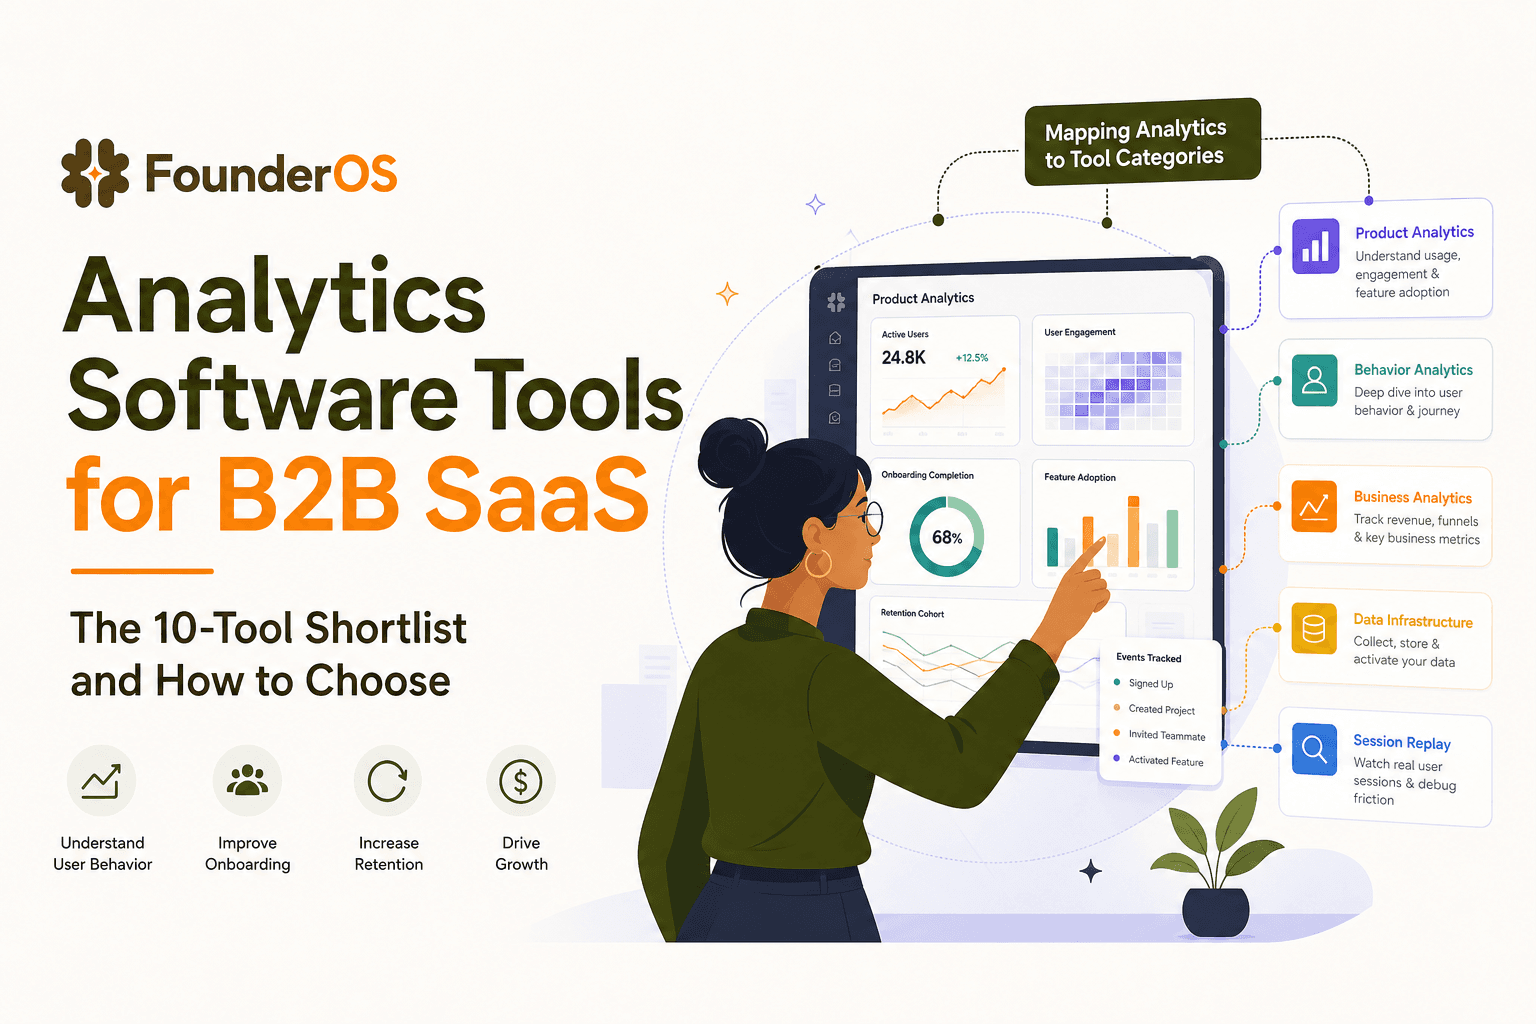
Analytics Software Tools for B2B SaaS - The 10-Tool Shortlist and How to Choose
A BOFU-ready shortlist of analytics software tools for B2B SaaS: 10 picks across categories plus a buyer rubric and rollout plan.

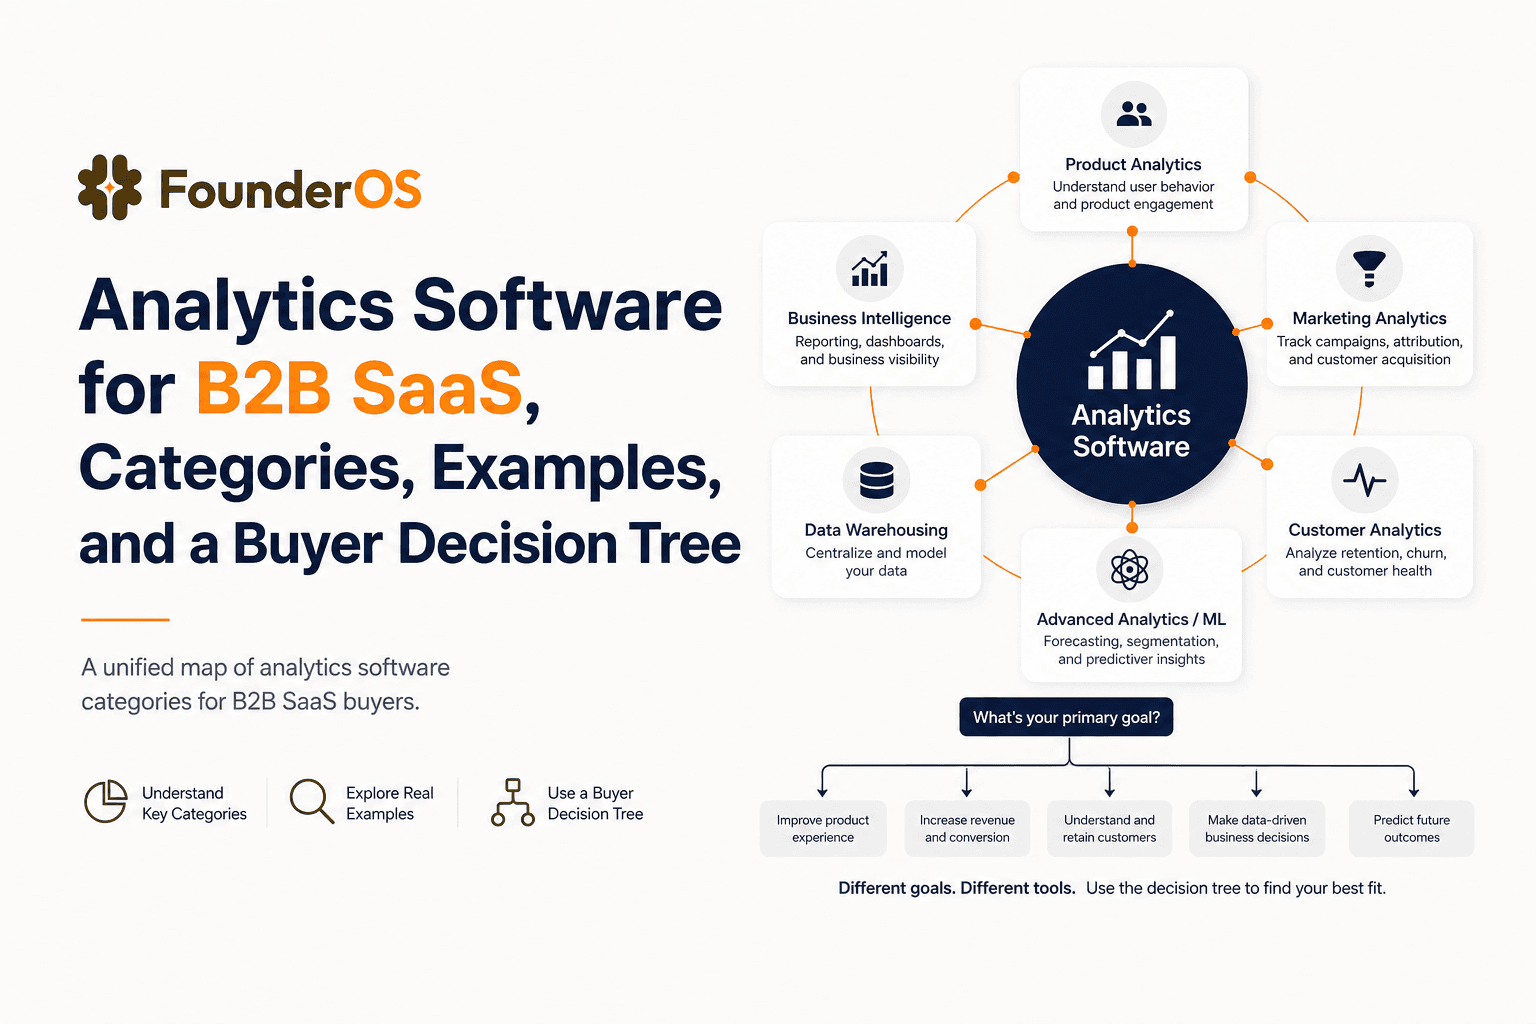
Analytics Software for B2B SaaS, Categories, Examples, and a Buyer Decision Tree
Choose analytics software for B2B SaaS with a clear category map, 10-minute decision tree, real workflows, and a practical buyer checklist.
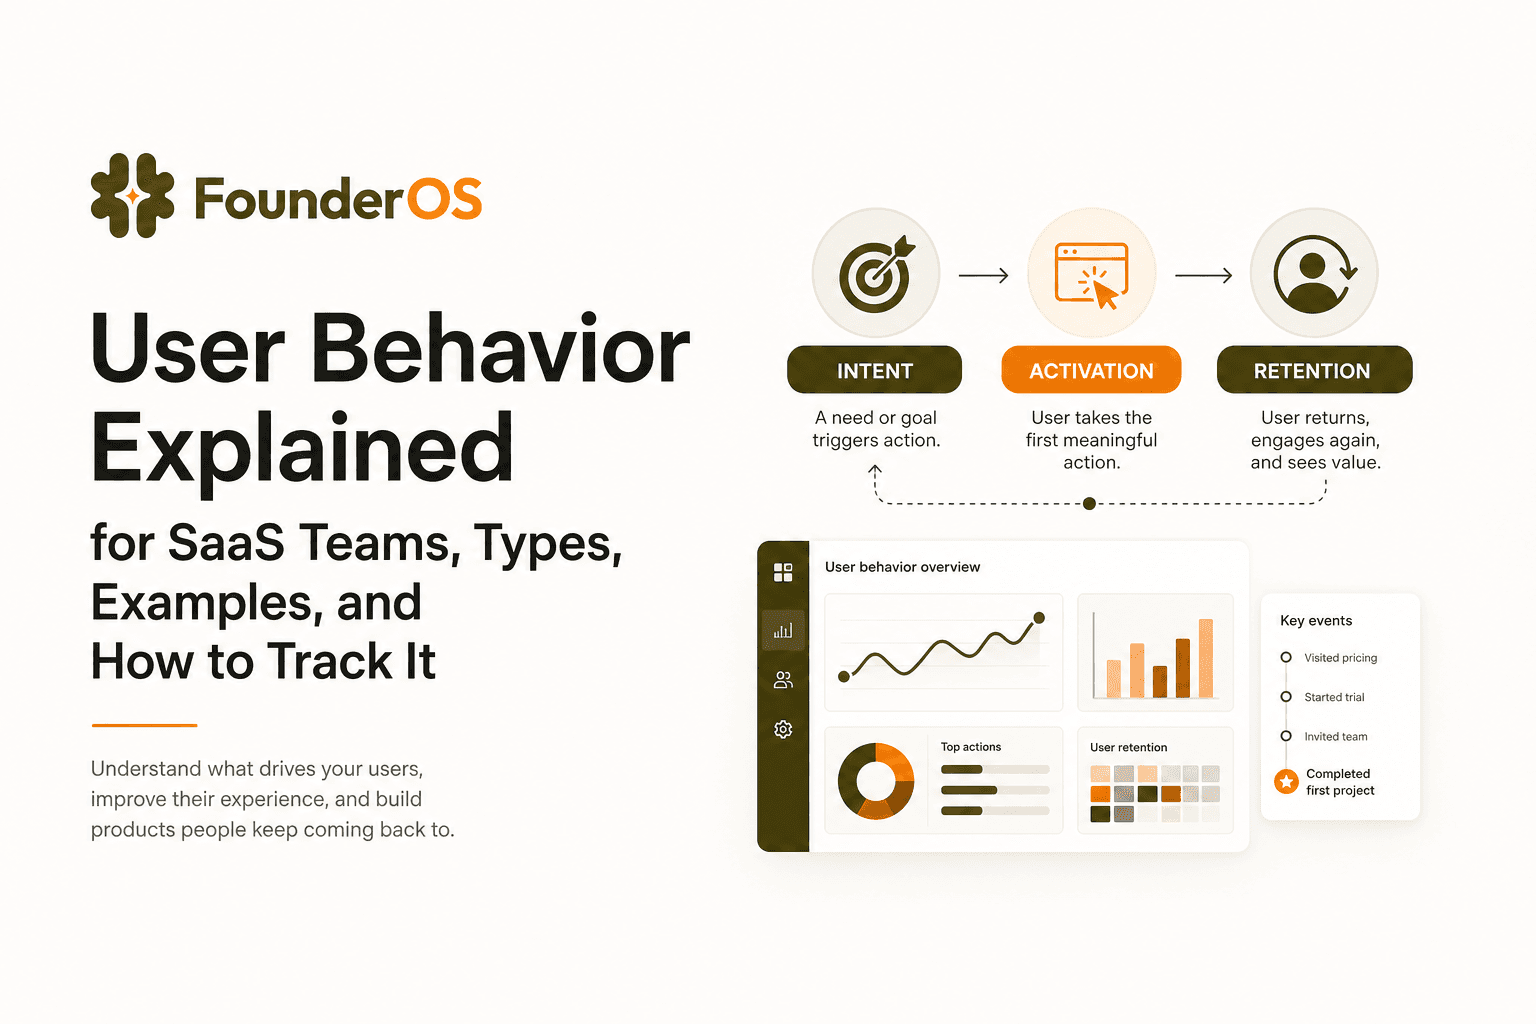
User Behavior Explained for SaaS Teams, Types, Examples, and How to Track It
Learn what user behavior means in SaaS, the key types, and a practical event tracking playbook to turn user behavior into product decisions.